|
|
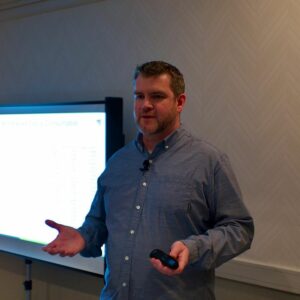
 Sacha Dawes presents at Tech Field Day 20 |
A Journey Into Data Visualization with SolarWinds
Watch on YouTube
Watch on Vimeo
A key challenge with modern IT is how to effectively monitor vast, complex systems that generate extreme volumes of data.
Visualization of big data provides an easier way for users to understand and make decision on their IT environments, particularly in a world with increasing complexity and scale.
The Orion Platform has evolved from its beginnings in the network monitoring to the full breadth of infrastructure and application monitoring and management that it helps organizations achieve today.
A key part of that journey has been visualization of that data, starting with simple network maps, and introducing new dynamic dependency and performance visualizations that can be automatically or manually created and incorporated into powerful dashboards and views.
Personnel: Sacha Dawes
SolarWinds Visual Root Cause Analysis Demo
Watch on YouTube
Watch on Vimeo
During the product demo we will cover the evolution of visualization within the Orion Platform, and show how we align to core visualization design principles to reveal data in a way that is intuitive, that provides context, and that helps improve decision making when monitoring complex, dispersed IT environments.
Personnel: Sacha Dawes


